Statistics · Updated Oct 16, 2026 · Next update Nov 19, 2026 (Census Q3 2026 ecommerce release, with revised figures)
US Ecommerce & Online Shopping Statistics (2026)
How much Americans buy online, how fast it is growing, and what the official figures can and can't tell you. Every number comes from the agency that publishes it.
2025–26 figures are as first published. Revised figures come on November 19, 2026.
Using these figures
Free to use. A mention of Sauron and a link back is appreciated.
Source: Sauron analysis of US Census Bureau data, https://sauron.so/research/ecommerce-statistics
Laurence Tuchin, founder
press@sauron.so
Need figures for your state or a different cut? Email us.
How much of US retail is online
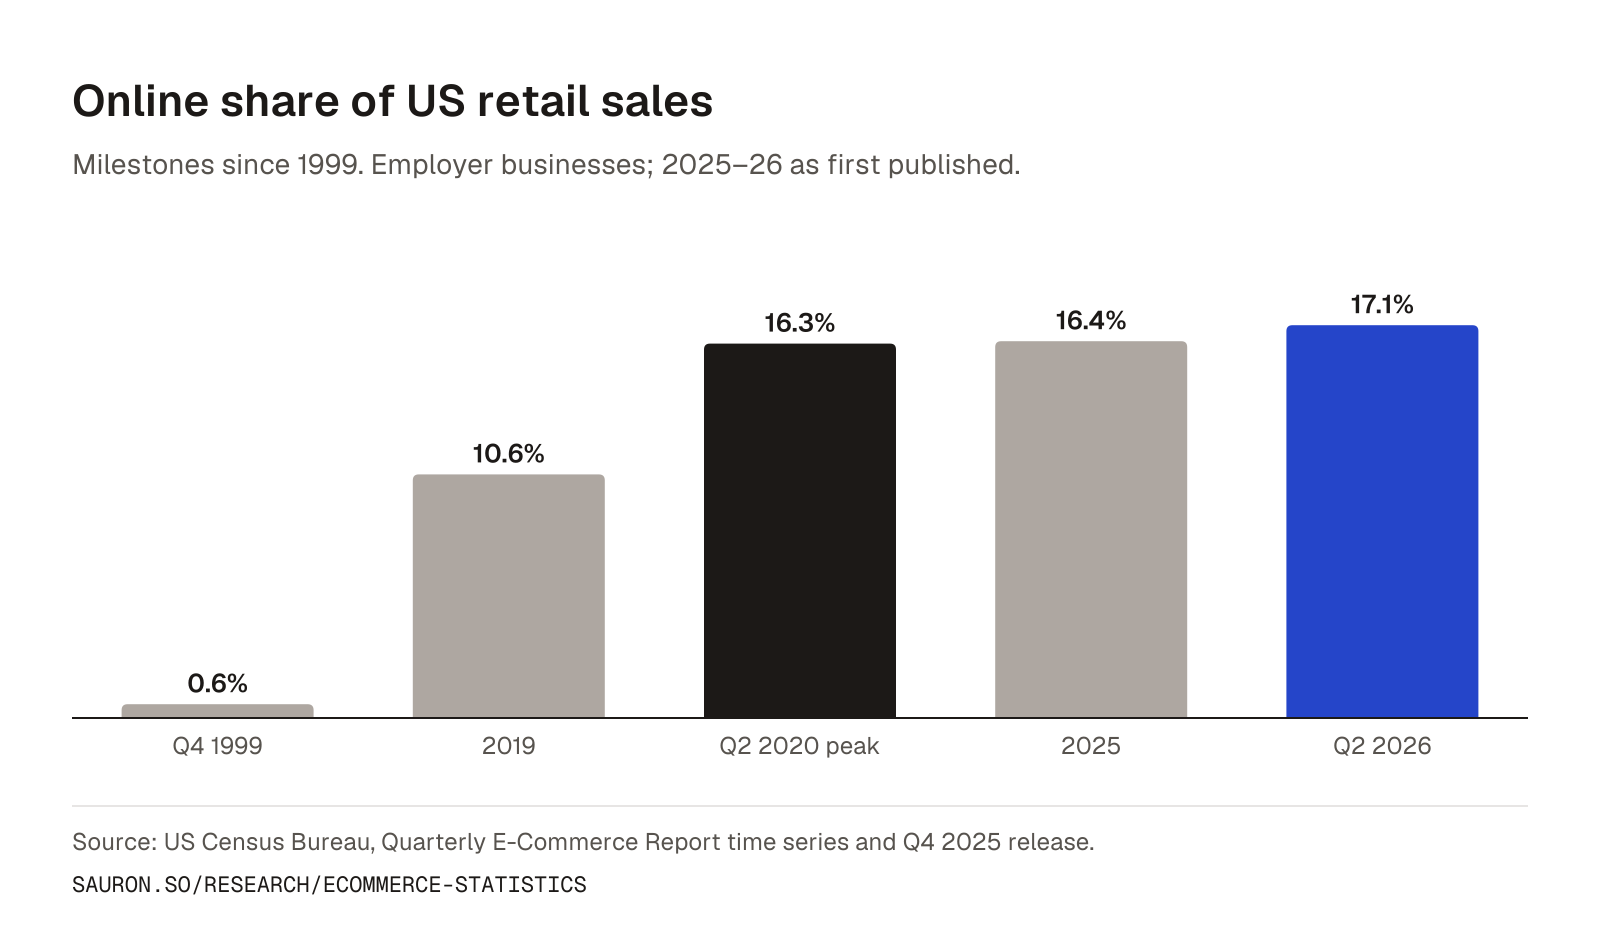
Online's share of retail is now above its 2020 lockdown peak, without the lockdown.
Show the numbers
| Period | Ecommerce share of retail | Note |
|---|---|---|
| Q4 1999 | 0.6% | first quarter of the series |
| 2019 | 10.6% | full year |
| Q2 2020 | 16.3% | lockdown peak |
| 2025 | 16.4% | full year, as first published |
| Q2 2026 | 17.1% | as first published |
All rows come from the Census Bureau's current series (employer businesses only since April 2025), so they are on one basis.
How fast online sales are growing
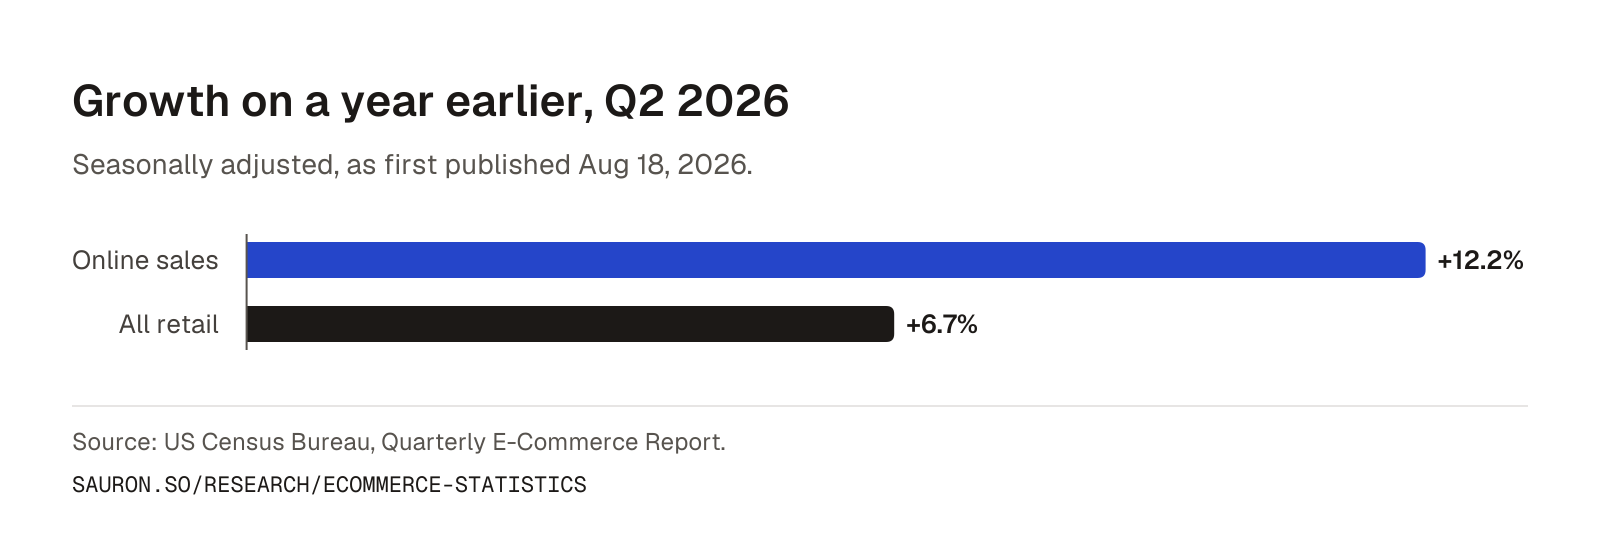
Online sales grew almost twice as fast as retail overall: +12.2% against +6.7% on a year earlier.
Growth on a year earlier, Q2 2026
Seasonally adjusted, as first published Aug 18, 2026.
Show the numbers
| Item | Growth |
|---|---|
| Online sales | +12.2% |
| All retail | +6.7% |
Download or embed this chart
Download PNG (1600px) Free to use. A link back to this page is appreciated.
<a href="https://sauron.so/research/ecommerce-statistics"><img src="https://sauron.so/research/charts/ecommerce-growth-q2-2026.png" alt="Bar chart: US online sales grew 12.2% on a year earlier in Q2 2026, against 6.7% for all retail." width="800" style="max-width:100%;height:auto"></a>
<p>Chart: <a href="https://sauron.so/research/ecommerce-statistics">Sauron Research</a></p>In Q2 2026, US online sales grew 3.8% on the quarter before and 12.2% on the same quarter a year earlier, as first published. Both will be restated with the revised figures on November 19, 2026.
Why “as first published”: the Census Bureau published the Q2 2026 figures on August 18, 2026 and the 2025 figures on March 10, 2026. It revised its retail estimates on September 28, 2026 and will publish revised ecommerce figures with the Q3 release on November 19, 2026. We'll update this page that day.
How many online stores are there?
There is no official count. Be careful with pages that quote one.
new business applications in August 2026 were for retail (104,087 of 531,728). That includes online stores, but isn't a count of them. More in our small business statistics.
There is no official count of US online stores. Under the 2022 industry classification (NAICS 2022), used in the Economic Census and the Census Bureau's annual surveys, online sellers are grouped with stores that sell the same products. Monthly retail figures still show “nonstore retailers”, but that group also covers mail order and direct selling, so it isn't a count of online stores either. Be careful with pages that quote a precise number of US online stores: it isn't government data.
What we can measure is search: see what shoppers search for during the holidays, how searches around prices and tariffs have changed and how often small stores reach page one of Google.
Related figures
What this means for small online stores
More spending moves online every year, but most of it goes to the stores shoppers find first. For a small store, that usually means being on the first page of Google for the products it sells. That's the job of an SEO app. We built Sauron to be the best SEO app for Shopify for small stores: it researches the searches your products can win and writes the collection pages and product copy for them.
More from this page
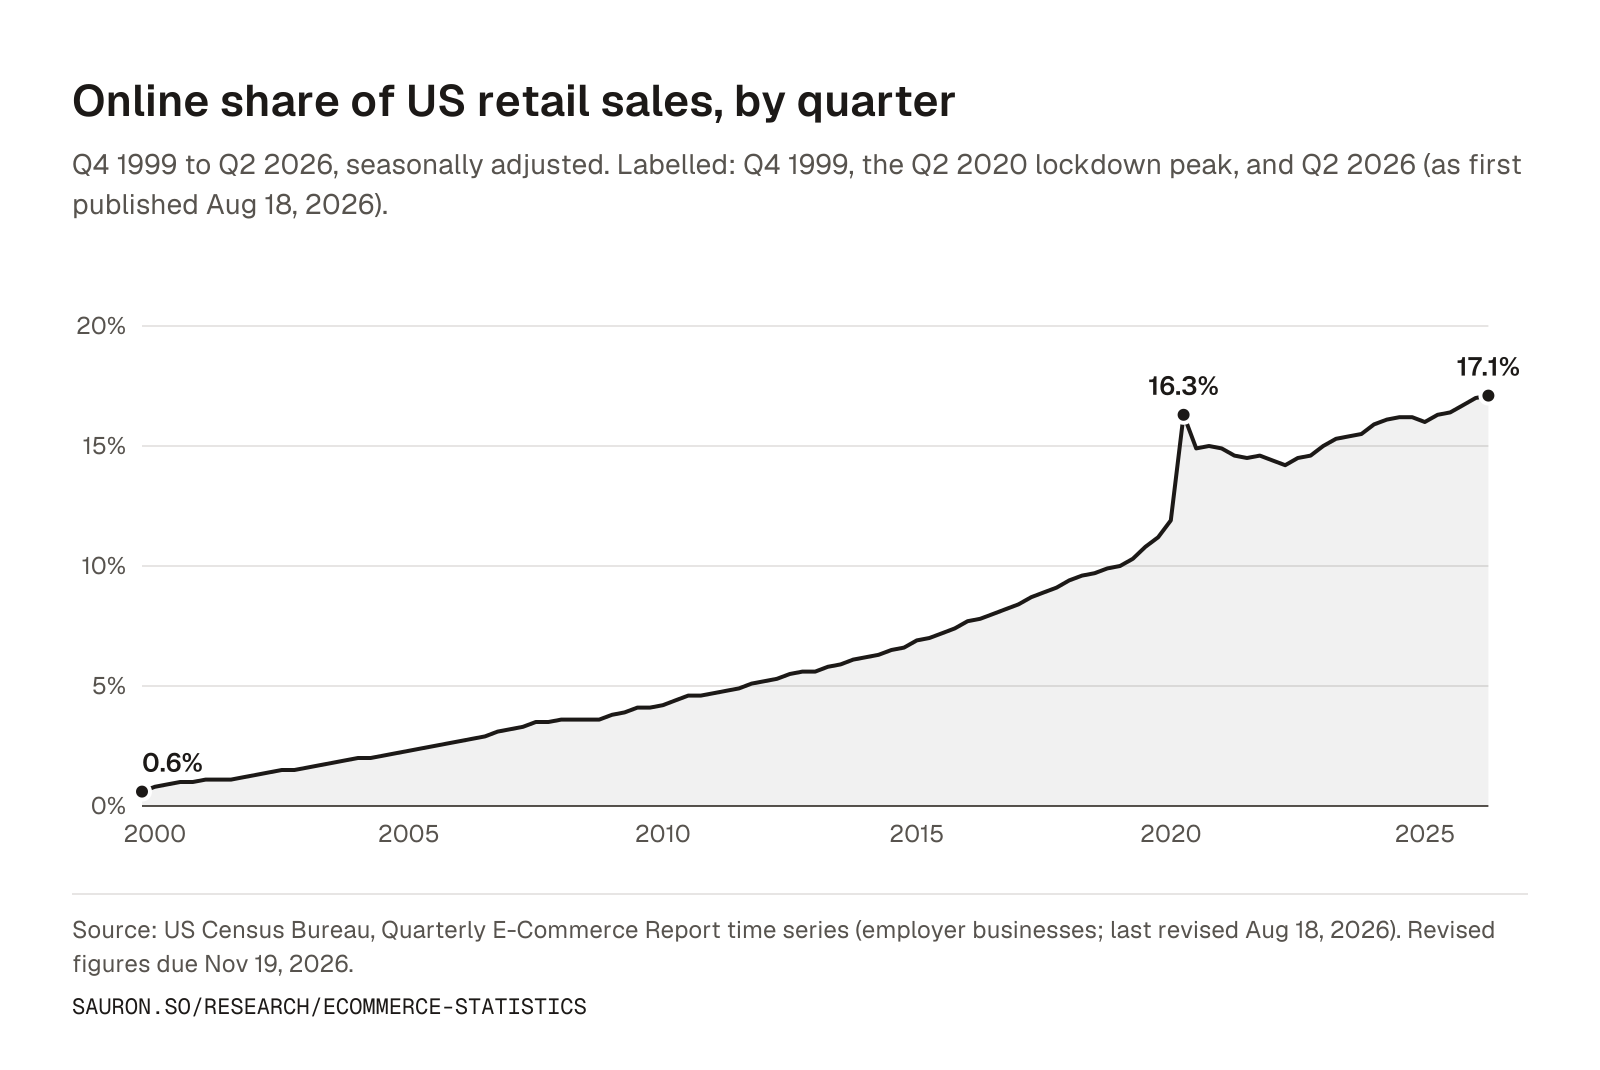
Every quarter since 1999
All rows come from the Census Bureau's current series, which has covered employer businesses only since April 2025. Older releases that also counted businesses with no employees give slightly different shares (11.0% for 2019, 16.1% for Q2 2020), so don't mix the two.
How we check figures
We take each number from the Census release or time series itself, not from other statistics pages.
Using these figures
Free to use. If you cite these figures, a mention of Sauron and a link back to this page is appreciated.
Suggested credit
Source: Sauron analysis of US Census Bureau data, https://sauron.so/research/ecommerce-statistics
Full method
- We take each number from the Census release or time series itself, not from other statistics pages.
- Quarter-to-quarter and year-to-year comparisons use seasonally adjusted figures. Holiday-quarter shares are not seasonally adjusted, because the point is the seasonal peak.
- Historical shares come from the current Census time series (employer businesses only since April 2025), so every row in the share table is on one basis.
- When the Census Bureau revises a series, we switch to the revised figures and say so. The next update follows the Q3 2026 release on November 19, 2026.
- The AI shopping figures use Google Ads search volume data (monthly Google searches, US), national only, for the 12 months to September 2026 compared with the 12 months before. Searches under 10,000 a year are not quoted; the full study lists them.
Sources
- Census Quarterly E-Commerce Report (opens in a new tab)
- Census e-commerce time series, seasonally adjusted (XLSX) (opens in a new tab)
- Census e-commerce time series, not seasonally adjusted (XLSX) (opens in a new tab)
- Census Q4 2025 release (opens in a new tab)
- Census release schedule (opens in a new tab)
- Census Business Formation Statistics (opens in a new tab)
- Census, November 2024 (opens in a new tab)
- BEA digital economy infographic (PDF) (opens in a new tab)
- BEA, digital economy (opens in a new tab)
Questions (3)
What percentage of US retail sales are online?
17.1% in Q2 2026 (seasonally adjusted, as first published August 18, 2026), according to the US Census Bureau. For the full year 2025 it was 16.4%. Revised figures come out on November 19, 2026.
How much did Americans spend online in 2025?
$1.23 trillion, according to the US Census Bureau's Q4 2025 ecommerce release (March 10, 2026).
How many online stores are there in the US?
No government agency publishes this number. In its 2022 industry classification, the Census Bureau groups online sellers with stores selling the same products, so there is no official count of online stores.