Study · October 14, 2026 · March–August 2026 · 50 states
Prices and Tariffs: What Americans Search For (2026)
Google searches about tariffs, buying American, dupes, deals, buy now pay later and secondhand, nationally and state by state.
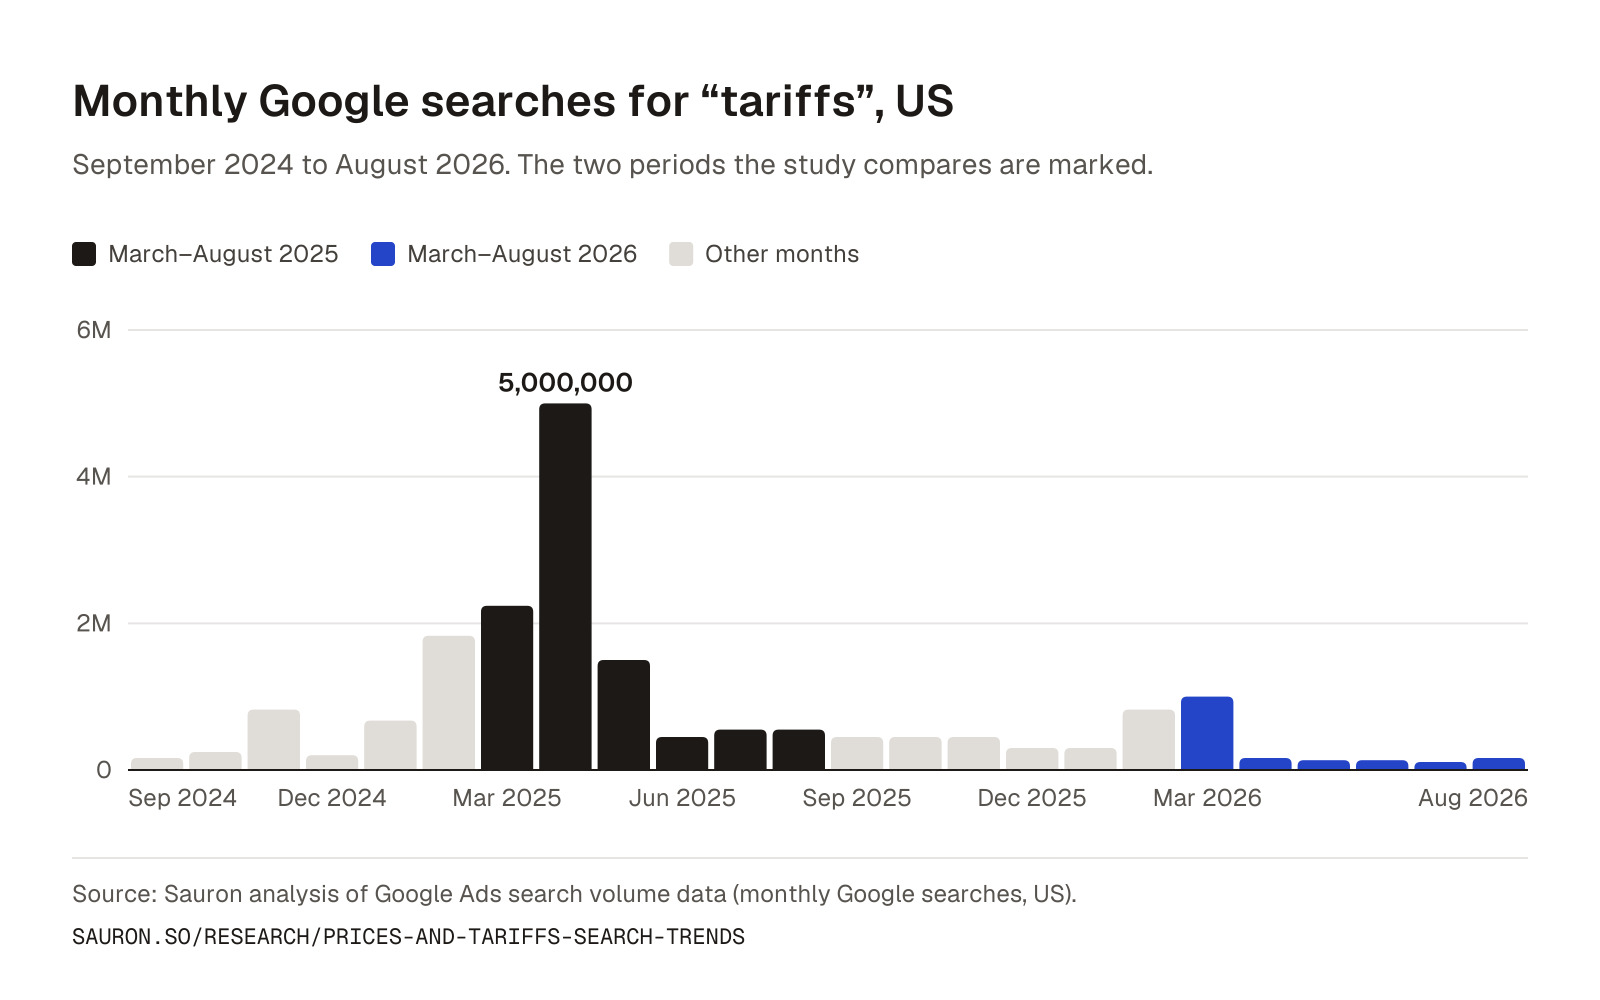
Google searches for “tariffs”, March–August 2026 against the same months of 2025 (1,710,000 vs 10,290,000).
searches about buying American. Arkansas searched most per resident (262 searches per 100,000 people, 2.1 times the rate of Wyoming, the next state).
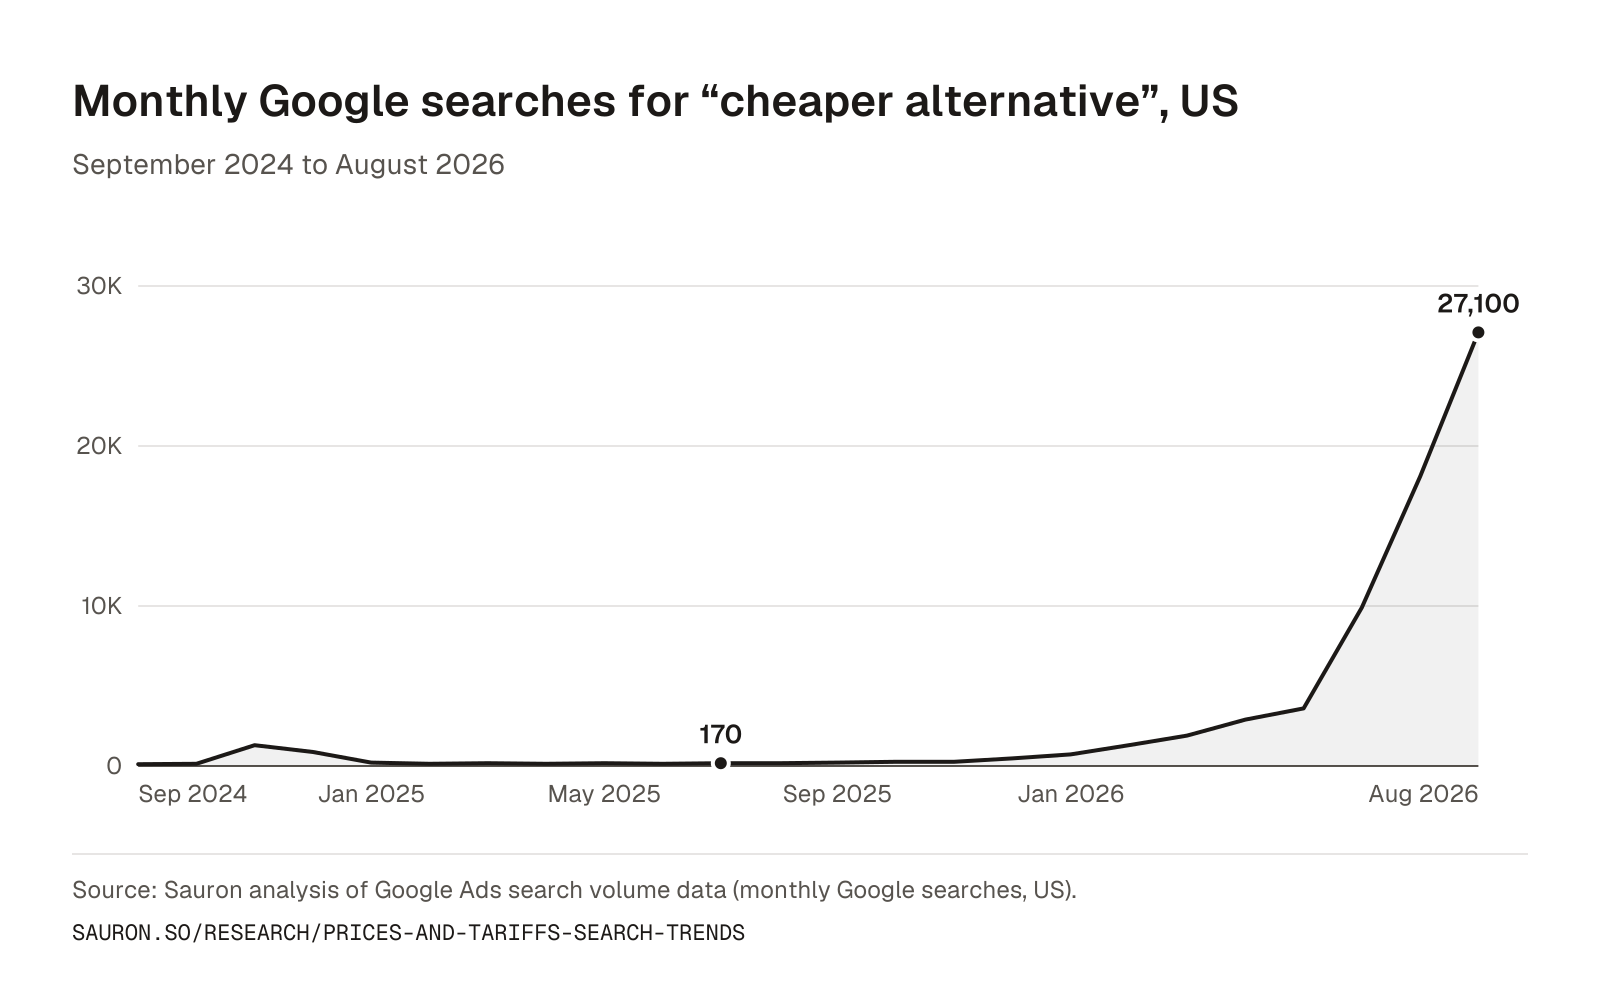
monthly searches for “cheaper alternative”, July 2025 to August 2026.
Sauron analysis of Google search volumes · Monthly, July 2025 to August 2026
buy now, pay later searches. Georgia searched most per resident (3,374 searches per 100,000 people).
secondhand searches (thrift stores, “secondhand”, “refurbished”). No state clearly leads: Colorado, Oregon and Montana are each within 5% of the state above.
Using these figures
Free to use. A mention of Sauron and a link back is appreciated.
Source: Sauron analysis of Google search volumes, https://sauron.so/research/prices-and-tariffs-search-trends
- All searches by state (CSV)
- Keyword table (CSV)
- Themes by state (CSV)
- Charts (PNG and embed code)
- All headline figures and the chart pack
Laurence Tuchin, founder
press@sauron.so
Writing about your state? We'll send its figures. Email us.
Which state searches most
Tariffs and prices
No state clearly leads: Maine, Michigan and Pennsylvania are each within 5% of the state above.
- 1 Maine 629
- 2 Michigan 625.2
- 3 Pennsylvania 615.4
- 4 New Jersey 603.4
- 5 Wisconsin 598.9
- Searches per 100,000 residents. All 50 states (CSV)
Buying American
Arkansas searched most per resident (262 searches per 100,000 people, 2.1 times the rate of Wyoming, the next state).
- 1 Arkansas 262
- 2 Wyoming 124
- 3 Louisiana 120.6
- 4 Alaska 119.4
- 5 Montana 117.1
- Searches per 100,000 residents. All 50 states (CSV)
Dupes and cheaper swaps
- 1 Alaska 568.3
- 2 New York 250.1
- 3 California 226.7
- 4 Virginia 225.6
- 5 New Jersey 216.9
- Searches per 100,000 residents. All 50 states (CSV)
Buy now, pay later
Georgia searched most per resident (3,374 searches per 100,000 people).
- 1 Georgia 3,374.4
- 2 Alabama 2,842.2
- 3 North Carolina 2,803.2
- 4 Mississippi 2,750
- 5 Maryland 2,729.3
- Searches per 100,000 residents. All 50 states (CSV)
Secondhand
No state clearly leads: Colorado, Oregon and Montana are each within 5% of the state above.
- 1 Colorado 13,277.5
- 2 Oregon 12,929.7
- 3 Montana 12,840.1
- 4 Idaho 12,155.3
- 5 North Carolina 12,102.4
- Searches per 100,000 residents. All 50 states (CSV)
Shades are fifths of the 50 states for that theme: the darkest are its top 10. Each theme has its own scale, so compare shades within one map, not across maps. Coupons and deal tracking has no map: most of its top states carry a sudden one-month jump.
Show the numbers
| State | Tariffs | Buying American | Dupes | Pay later | Secondhand |
|---|---|---|---|---|---|
| AL | 418 | 95 | 154 | 2,842 | 11,687 |
| AK | 395 | 119 | 568 | 1,034 | 9,610 |
| AZ | 555 | 105 | 184 | 2,075 | 7,498 |
| AR | 456 | 262 | 160 | 2,339 | 6,278 |
| CA | 444 | 105 | 227 | 2,035 | 8,583 |
| CO | 508 | 113 | 164 | 1,732 | 13,278 |
| CT | 467 | 97 | 176 | 2,096 | 5,726 |
| DE | 564 | 92 | 164 | 2,295 | 11,146 |
| DC | 1,393 | 215 | 466 | 4,205 | 16,611 |
| FL | 497 | 102 | 206 | 2,465 | 10,956 |
| GA | 587 | 101 | 211 | 3,374 | 8,366 |
| HI | 467 | 82 | 179 | 1,057 | 8,037 |
| ID | 492 | 104 | 123 | 1,198 | 12,155 |
| IL | 546 | 113 | 202 | 2,278 | 7,930 |
| IN | 498 | 93 | 137 | 2,009 | 5,506 |
| IA | 568 | 102 | 126 | 1,368 | 6,921 |
| KS | 499 | 105 | 151 | 1,630 | 8,023 |
| KY | 467 | 97 | 136 | 2,064 | 5,369 |
| LA | 382 | 121 | 171 | 2,663 | 6,346 |
| ME | 629 | 95 | 141 | 1,485 | 9,747 |
| MD | 494 | 82 | 205 | 2,729 | 8,867 |
| MA | 487 | 90 | 186 | 1,782 | 8,296 |
| MI | 625 | 90 | 159 | 1,808 | 9,008 |
| MN | 542 | 102 | 158 | 1,264 | 11,884 |
| MS | 385 | 85 | 132 | 2,750 | 5,428 |
| MO | 525 | 110 | 146 | 1,901 | 9,697 |
| MT | 568 | 117 | 111 | 1,054 | 12,840 |
| NE | 502 | 108 | 138 | 1,315 | 6,941 |
| NV | 547 | 108 | 200 | 2,604 | 7,548 |
| NH | 598 | 93 | 127 | 1,361 | 10,646 |
| NJ | 603 | 83 | 217 | 2,107 | 7,604 |
| NM | 495 | 92 | 128 | 1,923 | 7,774 |
| NY | 575 | 99 | 250 | 2,594 | 8,432 |
| NC | 553 | 99 | 193 | 2,803 | 12,102 |
| ND | 484 | 105 | 118 | 1,365 | 9,515 |
| OH | 528 | 92 | 146 | 2,114 | 7,924 |
| OK | 422 | 114 | 148 | 1,899 | 7,573 |
| OR | 589 | 97 | 166 | 1,506 | 12,930 |
| PA | 615 | 90 | 156 | 2,084 | 9,699 |
| RI | 495 | 105 | 169 | 1,886 | 7,125 |
| SC | 479 | 92 | 168 | 2,605 | 9,567 |
| SD | 473 | 101 | 110 | 1,115 | 6,533 |
| TN | 450 | 100 | 182 | 2,342 | 9,128 |
| TX | 462 | 116 | 207 | 2,713 | 7,891 |
| UT | 375 | 96 | 147 | 1,328 | 8,819 |
| VT | 495 | 104 | 124 | 1,291 | 11,574 |
| VA | 546 | 99 | 226 | 2,435 | 10,973 |
| WA | 590 | 106 | 173 | 1,492 | 11,046 |
| WV | 435 | 79 | 110 | 2,073 | 5,668 |
| WI | 599 | 95 | 121 | 1,359 | 8,973 |
| WY | 506 | 124 | 104 | 1,281 | 9,692 |
Download or embed this chart
Download PNG (1600px) Free to use. A link back to this page is appreciated.
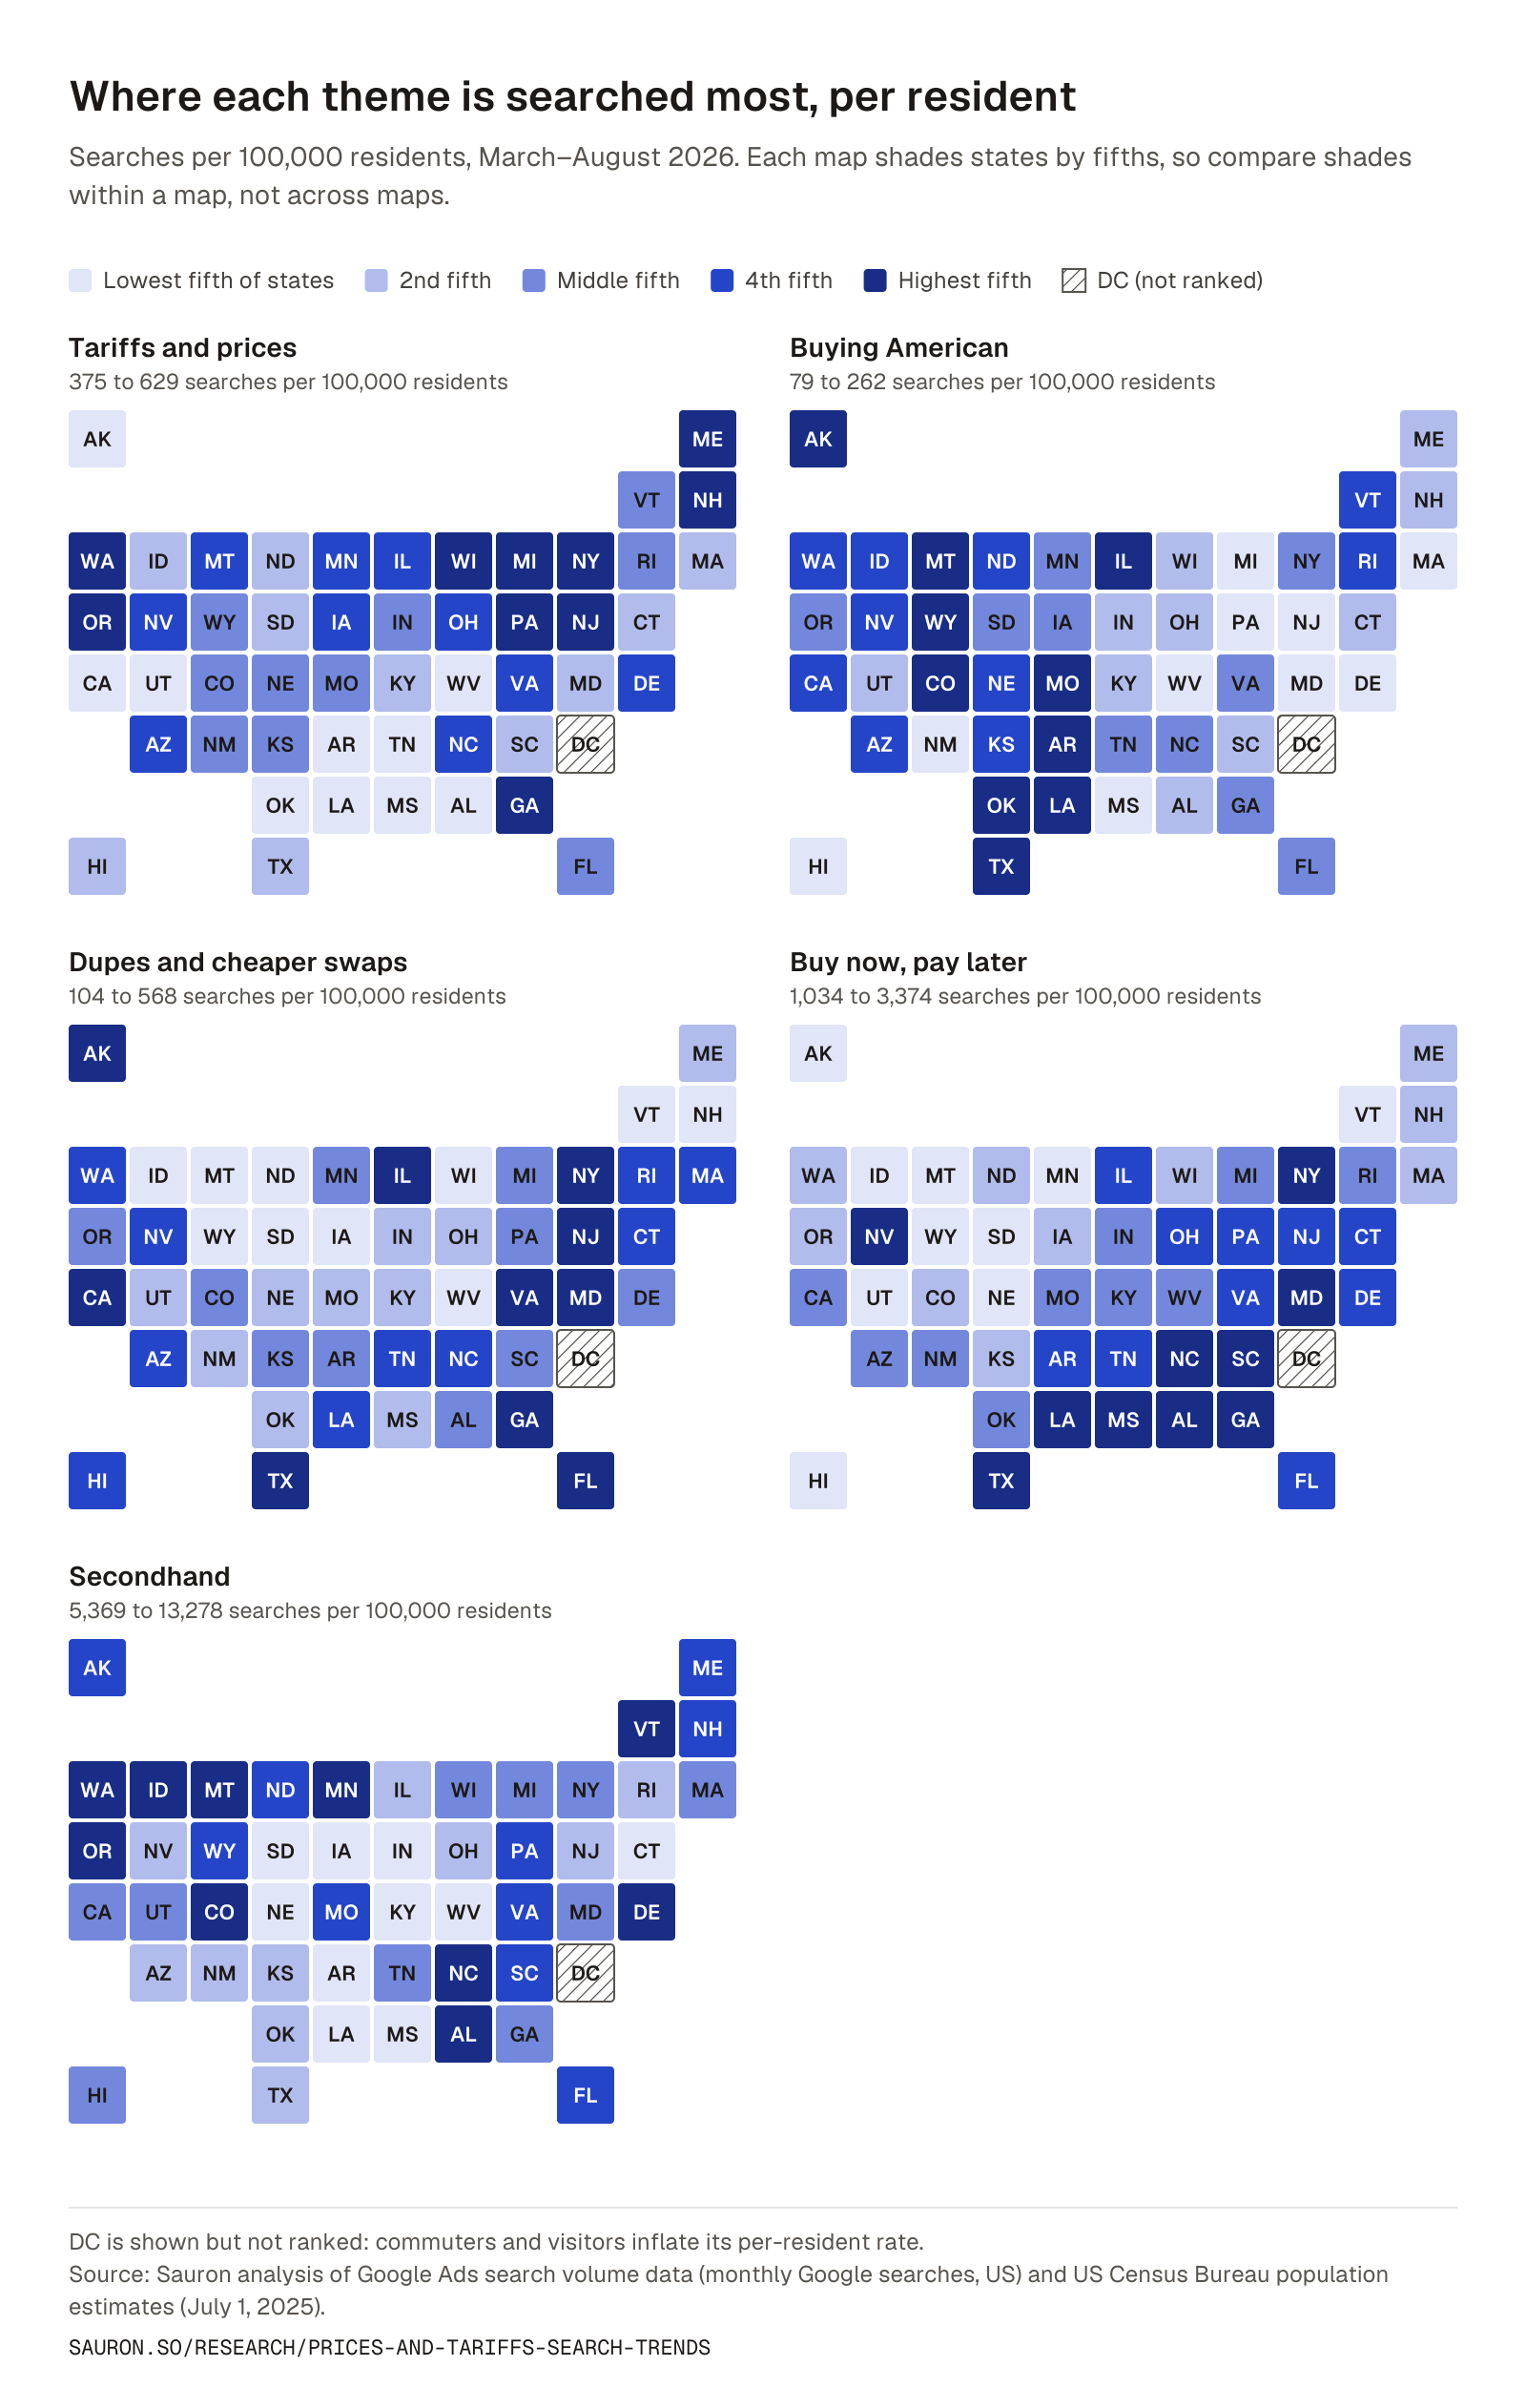
<a href="https://sauron.so/research/prices-and-tariffs-search-trends"><img src="https://sauron.so/research/charts/prices-state-maps.png" alt="Tile maps of the US, one per theme, shading states by searches per 100,000 residents. Highest per resident: tariffs and prices: Maine and Michigan; buying american: Arkansas; dupes and cheaper swaps: Alaska; buy now, pay later: Georgia; secondhand: Colorado and Oregon." width="800" style="max-width:100%;height:auto"></a>
<p>Chart: <a href="https://sauron.so/research/prices-and-tariffs-search-trends">Sauron Research</a></p>Searches for “tariffs”, month by month
Searches peaked at 5,000,000 in April 2025, spiked again to 1,000,000 in March 2026, and were 165,000 in August 2026.
Monthly Google searches for “tariffs”, US
September 2024 to August 2026. The two periods the study compares are marked.
Show the numbers
| Month | Searches | Period |
|---|---|---|
| September 2024 | 165,000 | |
| October 2024 | 246,000 | |
| November 2024 | 823,000 | |
| December 2024 | 201,000 | |
| January 2025 | 673,000 | |
| February 2025 | 1,830,000 | |
| March 2025 | 2,240,000 | March–August 2025 |
| April 2025 | 5,000,000 | March–August 2025 |
| May 2025 | 1,500,000 | March–August 2025 |
| June 2025 | 450,000 | March–August 2025 |
| July 2025 | 550,000 | March–August 2025 |
| August 2025 | 550,000 | March–August 2025 |
| September 2025 | 450,000 | |
| October 2025 | 450,000 | |
| November 2025 | 450,000 | |
| December 2025 | 301,000 | |
| January 2026 | 301,000 | |
| February 2026 | 823,000 | |
| March 2026 | 1,000,000 | March–August 2026 |
| April 2026 | 165,000 | March–August 2026 |
| May 2026 | 135,000 | March–August 2026 |
| June 2026 | 135,000 | March–August 2026 |
| July 2026 | 110,000 | March–August 2026 |
| August 2026 | 165,000 | March–August 2026 |
Download or embed this chart
Download PNG (1600px) Free to use. A link back to this page is appreciated.
<a href="https://sauron.so/research/prices-and-tariffs-search-trends"><img src="https://sauron.so/research/charts/tariffs-monthly-searches.png" alt="Monthly US Google searches for “tariffs” from September 2024 to August 2026: peak of 5,000,000 in April 2025, 165,000 in August 2026. March–August 2026 (cobalt) is compared with March–August 2025 (black)." width="800" style="max-width:100%;height:auto"></a>
<p>Chart: <a href="https://sauron.so/research/prices-and-tariffs-search-trends">Sauron Research</a></p>Over the months we compare (March–August 2026), searches were down 83% on the same months of 2025.
Every theme, nationally
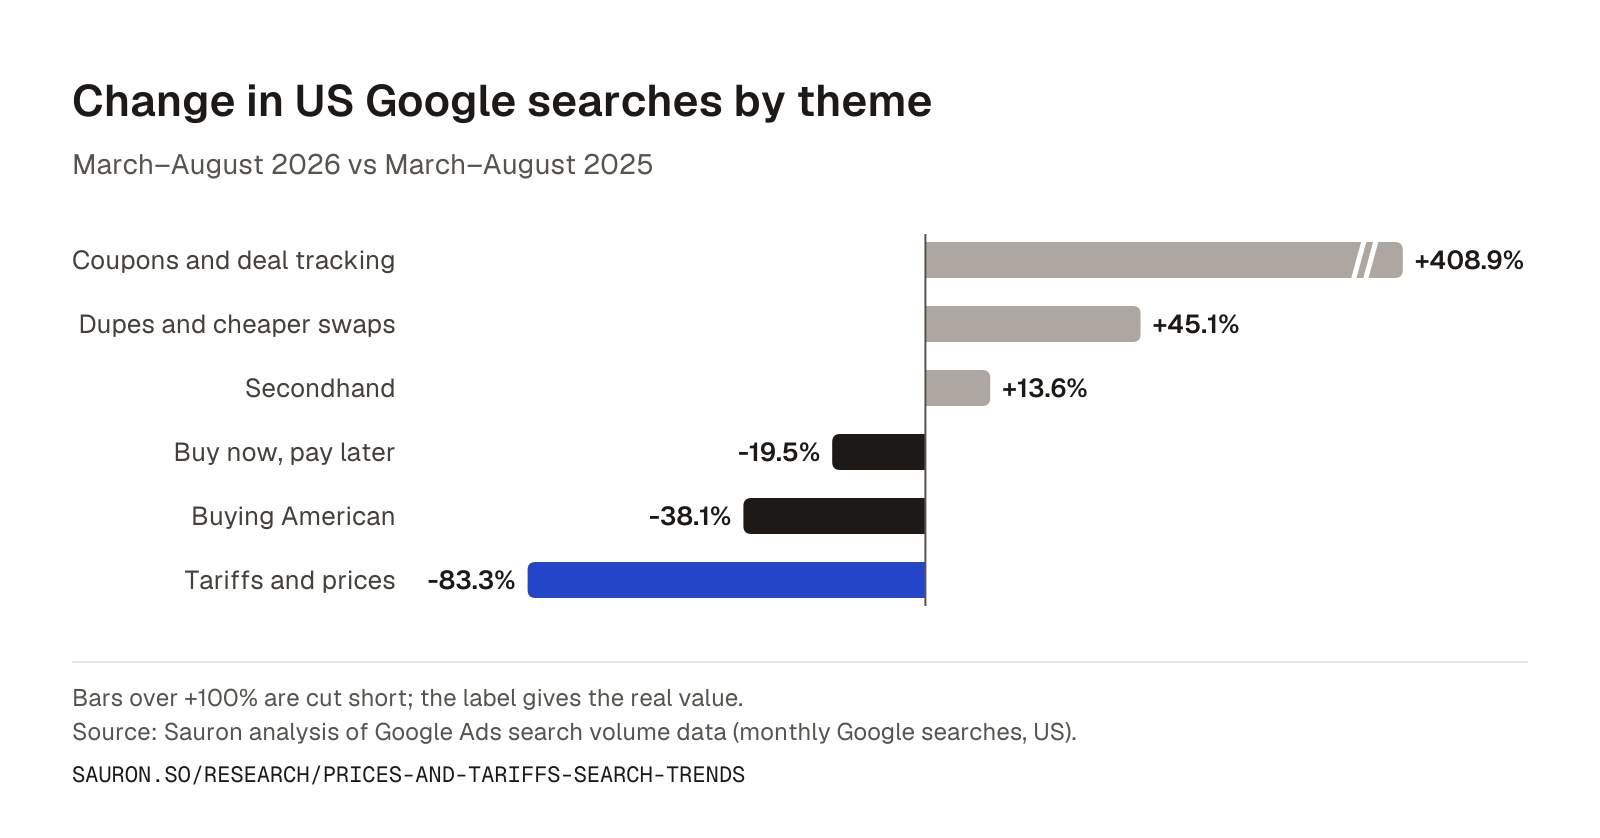
Searches about tariffs fell furthest, down 83%. Secondhand searches were up 14%.
Change in US Google searches by theme
March–August 2026 vs March–August 2025
Show the numbers
| Item | Change |
|---|---|
| Coupons and deal tracking | +408.9% |
| Dupes and cheaper swaps | +45.1% |
| Secondhand | +13.6% |
| Buy now, pay later | -19.5% |
| Buying American | -38.1% |
| Tariffs and prices | -83.3% |
Download or embed this chart
Download PNG (1600px) Free to use. A link back to this page is appreciated.
<a href="https://sauron.so/research/prices-and-tariffs-search-trends"><img src="https://sauron.so/research/charts/prices-themes-change.png" alt="Bar chart of the change in searches per theme, March–August 2026 against a year earlier. Down: Buy now, pay later -19.5%, Buying American -38.1%, Tariffs and prices -83.3%. Secondhand +13.6%. Coupons and dupes rose." width="800" style="max-width:100%;height:auto"></a>
<p>Chart: <a href="https://sauron.so/research/prices-and-tariffs-search-trends">Sauron Research</a></p>We grouped 19 searches into six themes and compared March–August 2026 with the same months of 2025.
Show the table
| Theme | Searches, March–August 2026 | March–August 2025 | Change |
|---|---|---|---|
| Tariffs and prices tariffs, tariff prices, will prices go up, price increase | 1,729,900 | 10,342,290 | -83.3% |
| Buying American made in usa, made in usa products, american made, buy american | 360,760 | 582,600 | -38.1% |
| Dupes and cheaper swaps dupe, cheaper alternative | 645,500 | 444,960 | +45.1% |
| Coupons and deal tracking coupon codes, discount code, price tracker | 1,390,700 | 273,300 | +408.9% |
| Buy now, pay later buy now pay later, afterpay, klarna | 7,741,500 | 9,613,500 | -19.5% |
| Secondhand secondhand, thrift store near me, refurbished | 30,504,200 | 26,844,700 | +13.6% |
US, March–August 2026, compared with the same months a year earlier. Each theme adds up the searches listed under it.
What this means for small stores
Searches like these sit on top of a bigger shift: more of US retail spending moves online every year (see our US ecommerce statistics). When shoppers search for a cheaper alternative, a dupe or something made in the USA, the stores that show up are the ones whose pages use those words. Sauron builds those collection pages for Shopify stores from search data like this.
More from this study
Tariffs and prices: states
| Rank | State | Searches per 100,000 | Searches, March–August 2026 | Population |
|---|---|---|---|---|
| 1 | Maine | 629 | 8,900 | 1,414,874 |
| 2 | Michigan | 625.2 | 63,320 | 10,127,884 |
| 3 | Pennsylvania | 615.4 | 80,370 | 13,059,432 |
| 4 | New Jersey | 603.4 | 57,610 | 9,548,215 |
| 5 | Wisconsin | 598.9 | 35,770 | 5,972,787 |
| 6 | New Hampshire | 598.4 | 8,470 | 1,415,342 |
| 7 | Washington | 590.2 | 47,220 | 8,001,020 |
| 8 | Oregon | 588.5 | 25,150 | 4,273,586 |
| 9 | Georgia | 586.8 | 66,330 | 11,302,748 |
| 10 | New York | 575.2 | 115,060 | 20,002,427 |
Top 10 of 50 states, ranked by searches per 100,000 residents. District of Columbia: 1,392.6 per 100,000, not ranked, because commuters and visitors inflate its per-resident rate.
Buying American
Searches for “american made”, “made in usa”, “made in usa products” and “buy american” together were down 38%. Not every search moved the same way: “made in usa” was up 39%, while “made in usa products” was down 79%. Arkansas searched most per resident (262 searches per 100,000 people, 2.1 times the rate of Wyoming, the next state).
| Rank | State | Searches per 100,000 | Searches, March–August 2026 | Population |
|---|---|---|---|---|
| 1 | Arkansas | 262 | 8,160 | 3,114,791 |
| 2 | Wyoming | 124 | 730 | 588,753 |
| 3 | Louisiana | 120.6 | 5,570 | 4,618,189 |
| 4 | Alaska | 119.4 | 880 | 737,270 |
| 5 | Montana | 117.1 | 1,340 | 1,144,694 |
| 6 | Texas | 116.2 | 36,860 | 31,709,821 |
| 7 | Oklahoma | 113.7 | 4,690 | 4,123,288 |
| 8 | Colorado | 113.4 | 6,820 | 6,012,561 |
| 9 | Illinois | 113.1 | 14,380 | 12,719,141 |
| 10 | Missouri | 110.2 | 6,910 | 6,270,541 |
Top 10 of 50 states, ranked by searches per 100,000 residents. District of Columbia: 214.8 per 100,000, not ranked, because commuters and visitors inflate its per-resident rate.
Dupes and cheaper swaps
Searches for “dupe” were up 31% (Google counts “dupes” as the same search, so we count it once).
“Cheaper alternative” is small but climbing: 170 searches a month in July 2025, 27,100 in August 2026.
Monthly Google searches for “cheaper alternative”, US
September 2024 to August 2026
Show the numbers
| Period | Searches |
|---|---|
| Sep 2024 | 110 |
| Oct 2024 | 140 |
| Nov 2024 | 1,300 |
| Dec 2024 | 880 |
| Jan 2025 | 210 |
| Feb 2025 | 140 |
| Mar 2025 | 170 |
| Apr 2025 | 140 |
| May 2025 | 170 |
| Jun 2025 | 140 |
| Jul 2025 | 170 |
| Aug 2025 | 170 |
| Sep 2025 | 210 |
| Oct 2025 | 260 |
| Nov 2025 | 260 |
| Dec 2025 | 480 |
| Jan 2026 | 720 |
| Feb 2026 | 1,300 |
| Mar 2026 | 1,900 |
| Apr 2026 | 2,900 |
| May 2026 | 3,600 |
| Jun 2026 | 9,900 |
| Jul 2026 | 18,100 |
| Aug 2026 | 27,100 |
Download or embed this chart
Download PNG (1600px) Free to use. A link back to this page is appreciated.
<a href="https://sauron.so/research/prices-and-tariffs-search-trends"><img src="https://sauron.so/research/charts/cheaper-alternative-monthly-searches.png" alt="US Google searches for “cheaper alternative” stayed near 170 a month until late 2025, then climbed every month to 27,100 in August 2026." width="800" style="max-width:100%;height:auto"></a>
<p>Chart: <a href="https://sauron.so/research/prices-and-tariffs-search-trends">Sauron Research</a></p>Dupes and cheaper swaps: states
| Rank | State | Searches per 100,000 | Searches, March–August 2026 | Population |
|---|---|---|---|---|
| 1 | Alaska | 568.3 | 4,190 | 737,270 |
| 2 | New York | 250.1 | 50,030 | 20,002,427 |
| 3 | California | 226.7 | 89,220 | 39,355,309 |
| 4 | Virginia | 225.6 | 20,030 | 8,880,107 |
| 5 | New Jersey | 216.9 | 20,710 | 9,548,215 |
| 6 | Georgia | 210.7 | 23,820 | 11,302,748 |
| 7 | Texas | 206.5 | 65,490 | 31,709,821 |
| 8 | Florida | 205.6 | 48,250 | 23,462,518 |
| 9 | Maryland | 204.9 | 12,840 | 6,265,347 |
| 10 | Illinois | 201.7 | 25,650 | 12,719,141 |
Top 10 of 50 states, ranked by searches per 100,000 residents. District of Columbia: 465.7 per 100,000, not ranked, because commuters and visitors inflate its per-resident rate.
Coupons and deal tracking
Searches for “coupon codes”, “discount code” and “price tracker” added up to 1,390,700 in March–August 2026. Most of that is “coupon codes”, which went from 90,500 searches in April 2026 to 550,000 in May.
Buy now, pay later
Searches for “buy now pay later”, Afterpay and Klarna together were down 20% (Klarna down 21%, Afterpay down 18%). Georgia searched most per resident (3,374 searches per 100,000 people).
| Rank | State | Searches per 100,000 | Searches, March–August 2026 | Population |
|---|---|---|---|---|
| 1 | Georgia | 3,374.4 | 381,400 | 11,302,748 |
| 2 | Alabama | 2,842.2 | 147,600 | 5,193,088 |
| 3 | North Carolina | 2,803.2 | 313,900 | 11,197,968 |
| 4 | Mississippi | 2,750 | 81,240 | 2,954,160 |
| 5 | Maryland | 2,729.3 | 171,000 | 6,265,347 |
| 6 | Texas | 2,713.4 | 860,400 | 31,709,821 |
| 7 | Louisiana | 2,663.4 | 123,000 | 4,618,189 |
| 8 | South Carolina | 2,604.9 | 145,100 | 5,570,274 |
| 9 | Nevada | 2,604.4 | 85,480 | 3,282,188 |
| 10 | New York | 2,593.7 | 518,800 | 20,002,427 |
Top 10 of 50 states, ranked by searches per 100,000 residents. District of Columbia: 4,205.3 per 100,000, not ranked, because commuters and visitors inflate its per-resident rate.
Secondhand
Searches for “thrift store near me”, “secondhand” and “refurbished” together were up 14%. “Thrift store near me” alone is most of this theme, and of the whole study. No state clearly leads: Colorado, Oregon and Montana are each within 5% of the state above.
| Rank | State | Searches per 100,000 | Searches, March–August 2026 | Population |
|---|---|---|---|---|
| 1 | Colorado | 13,277.5 | 798,320 | 6,012,561 |
| 2 | Oregon | 12,929.7 | 552,560 | 4,273,586 |
| 3 | Montana | 12,840.1 | 146,980 | 1,144,694 |
| 4 | Idaho | 12,155.3 | 246,720 | 2,029,733 |
| 5 | North Carolina | 12,102.4 | 1,355,220 | 11,197,968 |
| 6 | Minnesota | 11,884.4 | 692,910 | 5,830,405 |
| 7 | Alabama | 11,686.7 | 606,900 | 5,193,088 |
| 8 | Vermont | 11,573.5 | 74,610 | 644,663 |
| 9 | Delaware | 11,145.8 | 118,140 | 1,059,952 |
| 10 | Washington | 11,045.7 | 883,770 | 8,001,020 |
Top 10 of 50 states, ranked by searches per 100,000 residents. District of Columbia: 16,610.8 per 100,000, not ranked, because commuters and visitors inflate its per-resident rate.
Every search in the study
| Search | Searches, March–August 2026 | March–August 2025 | Change | Peak month |
|---|---|---|---|---|
| thrift store near me | 30,000,000 | 26,360,000 | +13.8% | August 2026 |
| klarna | 4,038,000 | 5,115,000 | -21.1% | December 2025 |
| afterpay | 3,300,000 | 4,038,000 | -18.3% | December 2025 |
| tariffs | 1,710,000 | 10,290,000 | -83.4% | April 2025 |
| coupon codes | 1,204,600 | 138,100 | +772.3% | May 2026 |
| dupe (incl. dupes) | 582,000 | 444,000 | +31.1% | August 2026 |
| buy now pay later | 403,500 | 460,500 | -12.4% | November 2024 |
| refurbished | 376,500 | 363,000 | +3.7% | August 2026 |
| american made | 279,000 | 447,000 | -37.6% | November 2025 |
| discount code | 137,500 | 68,700 | +100.1% | August 2026 |
| secondhand | 127,700 | 121,700 | +4.9% | October 2024 |
| cheaper alternative | 63,500 | 960 | +6,514.6% | August 2026 |
| made in usa | 59,600 | 43,000 | +38.6% | August 2026 |
| price tracker | 48,600 | 66,500 | -26.9% | November 2025 |
| price increase | 16,900 | 31,800 | -46.9% | April 2025 |
| made in usa products | 16,400 | 76,400 | -78.5% | April 2025 |
| buy american | 5,760 | 16,200 | -64.4% | April 2025 |
| will prices go up | 1,820 | 1,190 | +52.9% | August 2026 |
| tariff prices | 1,180 | 19,300 | -93.9% | April 2025 |
US, March–August 2026, compared with the same months a year earlier. Close variants Google counts as the same search are counted once.
How we did it
Monthly Google search volumes for 19 searches in 6 themes, for the US and each state, March–August 2026 against the same months of 2025. States are ranked per 100,000 residents (Census population). Searches show interest, not purchases.
Full method · All searches by state (CSV) · Sources · Questions
Using these figures
Free to use. If you cite these figures, a mention of Sauron and a link back to this page is appreciated.
Suggested credit
Source: Sauron analysis of Google search volumes, https://sauron.so/research/prices-and-tariffs-search-trends
Download the data All searches by state (CSV) Keyword table (CSV) Themes by state (CSV)
Full method
- Search data: Google Ads search volume data (monthly Google searches, US) for 19 searches in 6 themes, nationally and for each state and DC. Window: March–August 2026, compared with March–August 2025.
- Close variants: Google counts some searches as one (“dupe” and “dupes”). We count them once.
- Themes: each theme adds up the searches listed under it. States are ranked per 100,000 residents within each theme.
- DC: shown but not ranked, because commuters and visitors inflate its per-resident rate.
- Small numbers: We don't report a percentage change when either period has fewer than 100 searches.
- Per-capita figures: US Census Bureau population estimates for July 1, 2025.
- What this shows: These are searches, not purchases or opinions.
- Full data: CSV downloads in the “Using these figures” box: every search, each theme by state, and all searches added up by state. That last table is mostly “thrift store near me”, so we don't treat it as a finding.
Sources
Questions (3)
Are Americans searching for tariffs more or less in 2026?
Less. Google searches for “tariffs” were down 83% in March–August 2026 on the same months of 2025 (1,710,000 against 10,290,000), according to Sauron's analysis.
Which state searches most for American-made products?
Arkansas searched most per resident (262 searches per 100,000 people, 2.1 times the rate of Wyoming, the next state), in March–August 2026 (Sauron analysis of Google search volumes).
Are searches for buy now, pay later going up?
No. Searches for “buy now pay later”, Afterpay and Klarna together were down 20% in March–August 2026 on the same months of 2025.